The Standard for Bug Severity Classification (P1–P4)
Why Every Team Needs a Standardized Severity Matrix
In fast-moving software organizations, bugs are inevitable but chaos isn’t.
Without clear definitions and SLAs, teams waste valuable time debating what’s critical versus cosmetic, delaying fixes and clouding accountability.
A Bug Severity Matrix brings structure, consistency, and measurable discipline to triage and prioritization.
It helps teams respond faster, communicate clearly, and focus on what matters most protecting user experience and business continuity.
🔴 P1 – Critical / Hotfix (System Down)
Impact: Complete outage, critical data corruption, or exploited vulnerability
Scope: Affects ≥80% of users or any critical business system
Environment: Production only (unless security or compliance-related)
Workaround: None possible
Examples:
Production database down or corrupted
Payments API failing globally
Data breach or credential leak
Authentication system unavailable for all users
Response & SLA

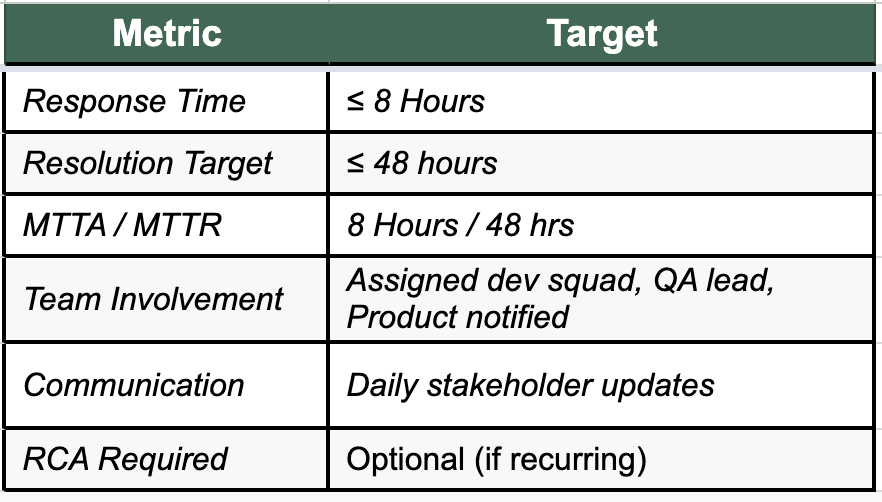
🟠 P2 – High Priority (Major Degradation)
Impact: Major feature or workflow broken, large user impact (>25%)
Scope: Business-critical feature unavailable or unreliable
Environment: Staging or Production
Workaround: Exists, but is difficult or risky
Examples:
Payment retries failing for specific gateways
Reports exporting incorrect data
Major workflow broken for enterprise clients
Mobile app crashing on login
Response & SLA
🟡 P3 – Medium Priority (Limited Impact)
Impact: Partial feature failure, small user subset (<25%) impacted
Scope: Non-critical path issues with an available workaround
Environment: Any non-production environment or low-risk production area
Workaround: Easily available
Examples:
Dropdown not sorting correctly
Export missing optional columns
Minor CSS/UI alignment issues
One report timing out under rare conditions
Response & SLA

🟢 P4 – Low Priority / Cosmetic (Nice-to-Have)
Impact: No functional degradation, purely visual or documentation issue
Scope: Affects limited visual components or internal tools
Environment: Any environment (including production)
Workaround: Not required
Examples:
Minor color mismatch or typo
Misaligned icons or padding issues
Enhancement ideas (e.g., add hover animation)
Refactoring suggestions or tech debt
Response & SLA

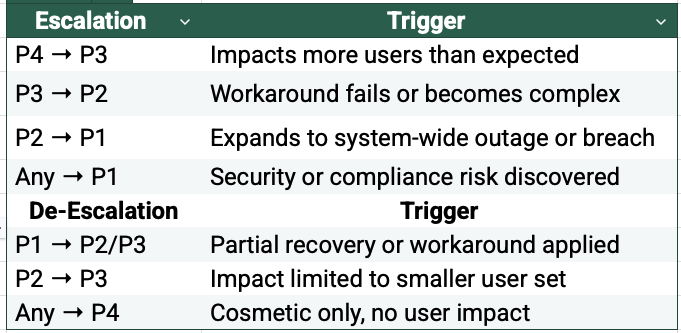
⚖️ Escalation & De-Escalation Rules
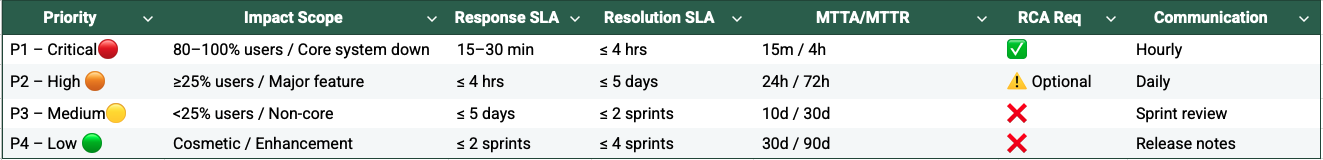
🧮 Bug Severity SLA Summary
📣 Best Practices for Implementation
Automate Severity Detection
Integrate CI/CD tools like Datadog or PagerDuty to auto-classify outages as P1 based on predefined thresholds.Use Standardized Bug Templates
Enforce completeness before triage — include environment, steps, expected vs actual behavior, and screenshots.Run a Cross-Functional Triage Board
Bring QA, Product, and Dev leads together bi-weekly to review high-impact issues and backlog health.Publish SLAs in Confluence
Make SLAs and definitions visible to all stakeholders for transparency and accountability.Link to RCA Tracker
Document learnings from P1/P2 incidents to prevent recurrence and improve release readiness.Report Severity Trends Quarterly
Track recurring modules, MTTR trends, and SLA breaches to identify systemic issues early.
🏁 Conclusion
A well-defined Bug Severity Matrix transforms firefighting into foresight.
By aligning every issue to clear impact definitions, measurable SLAs, and data-driven escalation rules, teams can triage faster, resolve smarter, and build stronger trust between QA, Product, and Engineering.
This framework isn’t just about fixing bugs — it’s about creating a culture of accountability, predictability, and quality excellence.